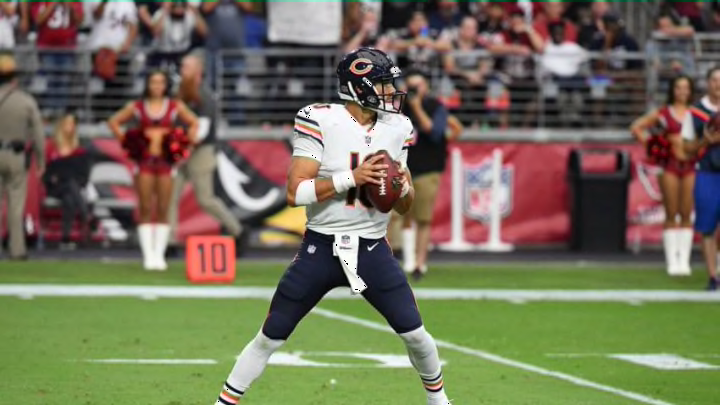
If you look at Jared Goff’s statistics through 15 NFL starts and compare them to Mitch Trubisky, it gives you a reason to give him time
Nobody is saying that Mitch Trubisky has lit the world on fire over the last three weeks. However, some of the hyperbole surrounding his development has gotten a little bit out of hand. Everyone is comparing him to his peers, but still, have to remember his developmental track his different than theirs.
The fact of the matter is that he played 15 NFL games with two different coordinators. Trubisky has received a lot of comparisons to Jared Goff in that regard. However, instead of looking at what Jared Goff is now, and saying Trubisky looks nothing like him, we have to think of what Goff looked like after just 15 starts.
When comparing Goff’s stats through 15 games to Trubisky, there are not gaping differences. Keep in mind, with this comparison Goff had nearly 1,000 more college pass attempts than Trubisky and had seven of his first 15 starts held back by Jeff Fisher, while Trubisky had 12 starts under John Fox. Considering five more starts with the offensive play calling of Sean McVay and the years of college attempts he has on Trubisky, his first 15 starts should look a lot better. Let’s dig in.
Completion Rate
Jared Goff completed 259 of his first 449 attempts to start his career. That is a 57.6% completion rate. Trubisky has thrown 15 fewer attempts but is 268-434. That is a 61.8% completion rate. Trubisky has completed passes at a higher rate than Jared Goff through 15 NFL starts.
Yardage
Jared Goff had 3,119 yards to start his career, sitting at 6.9 yards per attempt. This is slightly higher than Trubisky who had 2,784 yards in 15 starts, amounting to 6.4 yards per attempt. You could argue that considering the extra time in a better offense, this about the difference these two should have statistically.
Touchdowns
Goff gets a significant advantage over Trubisky in touchdowns through 15 starts. He has 18 touchdowns, throwing them on 4% of his pass attempts. Trubisky has nine at this point, throwing touchdowns at 2.1% rate. This is a big disparity but is aided by a four and three touchdown performance by Goff early into the McVay era. That was his third start and his eighth start in the McVay offense.
Interceptions
Trubisky does get a slight edge in interceptions, though. Goff has 11, throwing them at a 2.4% rate. Trubisky has thrown 10, at a 2.3% rate.
More from Bear Goggles On
- Franchise tag and transition tag windows open for Chicago Bears and NFL
- How the Chicago Bears can control the running back market in 2023
- The Chicago Bears can own the city of Chicago moving forward
- Chicago Bears NFL Combine Preview: Quarterback
- 7 best free agent tackle options for Chicago Bears
Record
With Trubisky throwing fewer interceptions at a higher completion rate and Goff throwing more touchdowns for more yards, the two even out a bit. That comes around full circle with the idea that Goff and Trubisky both carry a record of 6-9 as their respective teams starting quarterback.
Conclusion
When you look at Jared Goff’s 2017 season, it was that four-touchdown performance in his 15th career start that really broke him open into being a respected quarterback. Trubisky has just made his 15th start. Of course, Goff was in game eight of Sean McVay and had all of the college experience on top of that.
Still, expecting Trubisky to have much better numbers than he currently has is a bit optimistic. It should start to click over the next couple of weeks, and if it does not, his stats will likely start to differ from Goff. However, considering the context of each situation, he is still not far off of that pace.
