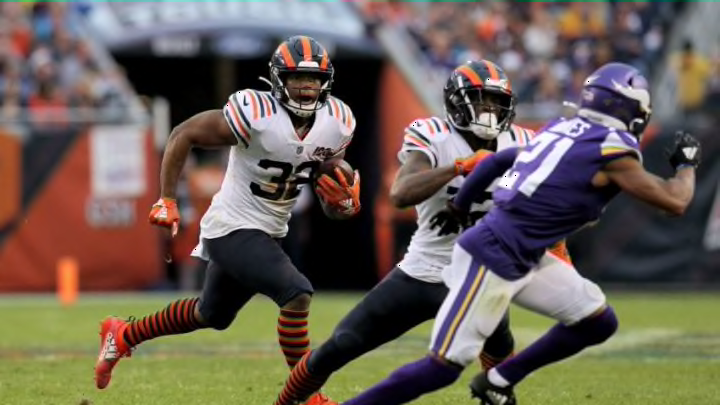
The Chicago Bears traded Jordan Howard and traded up for David Montgomery. Did that improve their run game?
One of the biggest offseason storylines, aside from the kicker was who would be the lead running back for the Chicago Bears in 2019. After rumors swirled around Jordan Howard from the day that Matt Nagy was hired that a trade may be coming, the Bears moved on from Howard and officially started a search to draft a running back.
After scouting many the team traded up when they thought they had their man. David Montgomery. Now that Montgomery has completed one season, it is a great chance to see how he has compared to Howard. Below are the raw statistics of the only year that Jordan Howard had with Matt Nagy compared to the rookie season of David Montgomery.
When looking from this aspect, it is arguable whether the move was all that impactful. The biggest questions come in targets and receptions. The argument for moving on from Howard was that another back could add to the passing game, but that was hardly the case with Montgomery.
Advanced stats come to David Montgomery’s defense
Many fans will point to Matt Nagy, Mitch Trubisky and the offensive line as reasons the run game has stalled with Montgomery. Fortunately, we are able to use some advanced stats that help single out a running backs performance. With the help of playerprofiler.com, we were able to see how each back compares in specific areas that they can affect.
Run Blocking Efficiency
According to the site, Run Blocking Efficiency (RBE) combines yards blocked per carry and short yards success rate into a single measurement of run blocking effectiveness across a running back’s rush attempts.
In 2018, the Bears rated 73.2 in RBE, while they rated 58.4 in 2019. The injury to Kyle Long that led to playing a UDFA with limited experience, along with shuffling James Daniels and Cody Whitehair showed statistically as Montgomery had to create more on his own, and struggled more in short-yardage situations than Howard.
Game Script
The game script did not do Montgomery favors either as his team was trailing more than 2018. On average the Bears led by 3.5 points per snap in 2018 while they trailed by 1.9 points per snap in 2018. The line and situation did Montgomery no favors, and the stats back that up.
Stacked Boxes
You can blame the team trailing and you can blame the offensive line. However, teams did not stack the box against Montgomery more than Howard. Montgomery saw an average of 6.5 defenders in the box to 6.7 for Howard.
Montgomery saw an 8-man box 14.5% of the time to 18.4% from Howard. This can be argued as another reason the team drafted Montgomery and traded Howard. Teams stacked boxes against Howard knowing he was coming straight at them. It is also worth noting that Montgomery averaged 2.4 yards per carry against stacked boxes while Howard averaged just 1.6.
True Yards
True yards takes away long, breakaway runs that can inflate a backs yards per carry. This focuses on consistent gains. The two were similar in this area, Montgomery averaged 3.5 yards per carry, and Howard averaged 3.6 The two also both averaged four yards per touch when accounting for every time they touched the football.
Breakaway Runs
This may surprise some, but Howard had nine breakaways, a 3.6% rate while Montgomery only had five, a 2.1% rate. Aside from pass-catching, which Montgomery cannot control, an upgrade from Howard was supposed to be to add a bigger play element. Howard had a low breakaway run rate.
You can point to the offensive line, but Montgomery did not provide breakaway runs at Iowa State either.
Evaded Tackles
This is where we start to see why the Bears did draft Montgomery. He evaded 75 tackles in 2019, 4.7 per game. That is a huge increase from Howard, who broke 29 tackles, just 1.8 per game.
Montgomery’s juke rate, which is evaded tackle per touch, is 28.7%, while Howard evaded a tackle on every 10.7% of his touches. A huge boost from Montgomery.
Yards created
Yards created is the number of yards that a back is responsible for after the first evaded tackle. The back had to make a move to get these yards, they are his and only his. Montgomery created 1.19 yards per carry while Howard only created 0.59 yards per carry.
Dominator Rating
Dominator Rating looks into the percent of the team’s total yards and touchdowns than an individual player is responsible for. While Howard may have more rushing yards, he was in a better offense overall. He did not have a bigger impact on the offense, though.
Montgomery had a 23% dominator rating while Howard had a 19% dominator rating. He made more defenders and created more after making defenders miss. It is fair to assume that if Montgomery were on the 2018 Bears, his stats would have been better than Howard.
