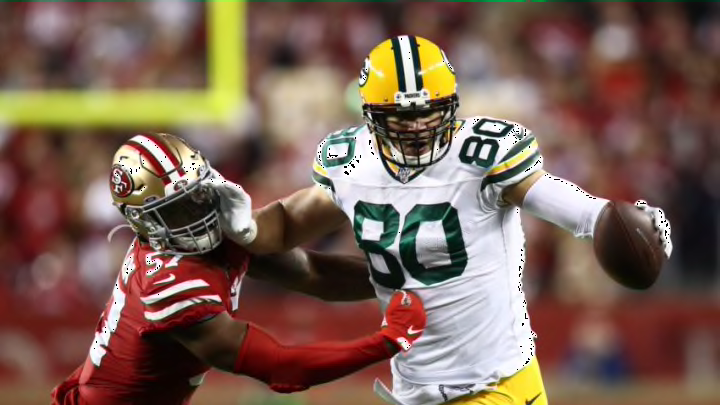
What do the advanced stats say about what the Chicago Bears are getting in Jimmy Graham?
The Chicago Bears signed Jimmy Graham to a two-year, $16 million deal which comes with $9 million guaranteed. We all knew the team was going to add some sort of tight end, so seeing Jimmy Graham get added is not much of a surprise.
Fans can see the stats and see what he is doing, but what do the numbers say when you look a bit deeper? Below are is the advanced stats review for Jimmy Graham.
Yards after the catch
Jimmy Graham has a lot a bit of the bounce in his step and the juice to turn it all the way up like he did when he played for the New Orleans Saints. However, one area where Graham has been better now than in the pass is yards after the catch.
For his career, Jimmy Graham averaged 4.5 yards after the catch per reception. However, in 2018, he averaged 4.7 yards after the catch per reception and in 2019 he averaged 6.7 yards after the catch.
Graham is not tearing up seams as much, but he is catching the ball in the flats and creating yards after the catch at a higher rate.
Average Target Distance
Still, Graham was being used down the field more often than Trey Burton. His average depth of target was 9.6 in 2018 and 8.9 in 2019. Burton had an average target distance of 5.4 yards last year, and 8.4 in 2018. Burton may stick with the Bears on top of Graham as Burton takes on shorter targets and Graham is a bit deeper down the field.
However, that also comes with an 0.83 RACR which looks into receiving yards per air yard. Receivers over one are usually the better playmakers. Graham was creating after the catch but was not cashing in on the depth of his targets. To be fair, had a 0.67 RACR last season. However, Graham had a 0.74 RACR in 2018, while Burton had a 0.96. Burton turned 604 air yards into 577 yards while Graham had 862 air yards, but 636 receiving. This can help signify how they are used in different capacities.
Drop Rate
Jimmy Graham had seven drops in 2017, a career-high. It resulted in an 11% drop rate. However, in the past two seasons, that rate has gone down to 3.5% and 7.3%. To compare to Trey Burton again, his drop rates have ranged from 4.5 to 5.3 and 12.5 over the past three years.
Last year Taylor Gabriel had a 9.4% drop rate, Anthony Miller had a 7.1% drop rate and Allen Robinson was 3%. Over the past three years, Graham would slide in between Gabriel and Miller from last year.
Pass Block Efficiency
According to Pro Football Focus, Graham has been a better blocker than pass-catcher over the past two seasons. Adding a blocker can take the wear and tear off of Trey Burton if he does stay in Chicago.
Still, Graham ranked 51st in run blocking snaps and ranked 16th in pressure rate allowed. When Graham is on the field, he is running routes. Of his 672 snaps, only 192 were spent blocking.
