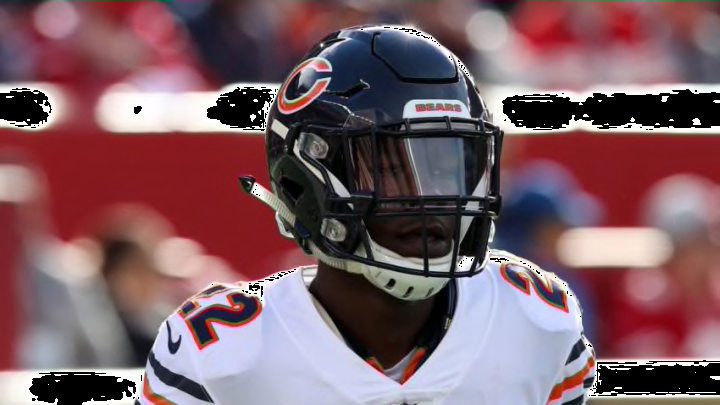
What do the advanced stats say about Artie Burns and how does he compare to Kevin Toliver?
Before entering the NFL draft, the Chicago Bears have a competition brewing at cornerback. Currently, Tre Roberson, Kevin Toliver and Artie Burns will all have a shot at being the Chicago Bears starting outside cornerback.
While Roberson was in the CFL, and he is hard to compare, Burns played 375 snaps over the past two seasons while Toliver played 311. Burns played 256 snaps in coverage to 204 for Toliver. They are close enough to where we can view them head to head and see a tale of the tape. Both corners played for teams with elite level pass rushes in front of them, so it is a more than fair to see how the two stack up. Who has been better the past two years?
Completion Rate
Toliver has been targeted more often despite less snaps overall. He has seen 36 targets his way, to only 31 for Burns. However, Burns allowed a 77.4% completion rate, with 24 completions allowed. Toliver allowed just 21 and a 58.3% completion rate allowed.
Yards Allowed
On more targets Toliver allowed, he gave up 286 yards. However, Burns gave up 345 passing yards on five less targets. Toliver is allowing 13.6 yards per catch allowed, while Burns was allowing 14..4.
Burns was also attacked deeper down the field. His average target averaged 8.9 air yards down the field. Toliver averaged 7.1 air yards down the field.
Beyond that, Burns allowed 2.67 yards after the catch per reception. Toliver was better to wrap up and close, as he allowed 1.38 yards after the catch per reception.
Touchdowns, penalties and plays on the ball
Beyond allowing less overall yards due to allowing less deep targets and allowing less after the catch, Toliver was also much more efficient at keeping his man out the end zone. He allowed one touchdown on his 36 targets, five of the 31 targets Burns faced went into the end zone over the past two seasons.
Beyond that, Burns also committed six penalties, while Toliver committed just one. Lastly, Toliver had three plays on the ball while Burns had just one. In almost every aspect of coverage, Toliver has been better over the past two years.
Run defense
Toliver had 28 tackles over the past two years compared to 22 by Burns. Burns missed three tackles, while Toliver missed four, though. One thing that is worth noting is that Burns had 10 missed tackles as a rookie, and five in his second year. His three over the past two shows progress, although on a much smaller sample size, it is hard to say tackling is a specialty for Burns. Especially when he struggled on special teams. Lastly, Burns had six run stuffs that went for unsuccessful plays according to PFF while Toliver had seven.
Overall
Burns is a first round pick while Kevin Toliver is a UDFA. However, when you stack the two up against each other in the NFL, Toliver has a more promising career at this point. Look for the two to compete, but do not be surprised if Toliver turns out to be the more polished corner.
