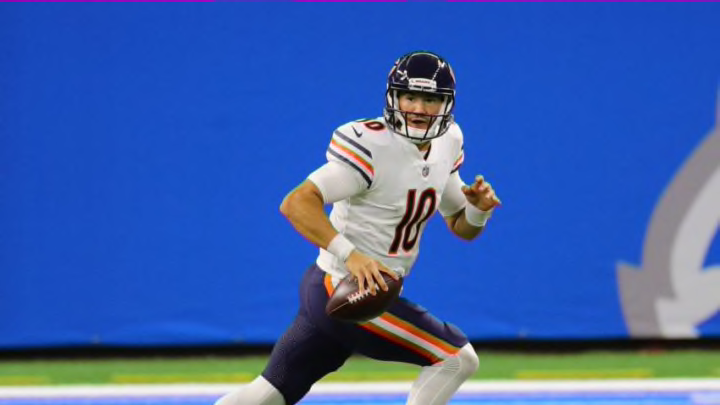
How did the advanced stats say that Mitch Trubisky has looked in 2020?
The nice thing about doing an advanced stats review for the 2018 and 2019 for Mitch Trubisky, is we now have a collection of stats from his best and worst season to see where the differences are. Since 2020 is a crucial is a year, this gives us a great chance to look at Trubisky week by week and see which way he is trending too, or if he is better or worse than past years in certain areas.
Under Pressure
Trubisky was under pressure 32% of the time in 2019, compared to 30% in 2018. On Sunday, he faced pressure just 27% of the time. That could be an indictment of the offensive line, or the Lions pressure, but he still saw less than a normal game. For what it is worth, Trubisky was 3-8 under pressure on Sunday according to PFF, which is a bit worse than his normal numbers, but is a very small sample.
Blitz
The Lions blitzed Trubisky 42% of the time, which is more than the past two years of 27, and 26% respectively. Still, the line gave up less pressure than usual. Beyond that, Trubisky has been awful against the blitz, seeing drops in most key statistics. In one game, and only 11 pass attempts against the blitz, he was 7-11, threw a touchdown, and had an 8.3 yards per attempt, which is better than when he sat in a clean pocket. This is a small sample, but noticing the blitz is mental. The line not allowing pressure against the blitz, and Trubisky excelling can show better pre-snap understanding.
Time to Throw
In the past two years, Trubisky has averaged 2.65, and 2.64 seconds to throw. Sunday, he averaged 2.99. That is higher than average because of some his scrambles, but this also shows that it may have been the line more than his processing. The times he held the ball too long were never leading to him making big plays happen, but rather him making mistakes. The line gave him time, and sometimes he was not decisive enough.
Air Yard Differential
Trubisky has had a -2.7 air yard to passing yard differential in both of the last two years. This year, it is down -2.3. This is not far off of his normal day, however, he also is averaging almost two yards further down the field in his intended distance. This also is likely being aided by the dime he dropped to win the game.
Air Yards to Sticks
In 2018, Trubisky was aggressive and threw 0.1 yards beyond the sticks. In 2019, he had a -1.2 differential, and was checking down more. On Sunday, he averaged 2.5 yards beyond the sticks per attempt. This likely again was aided by throwing deep late.
Aggressiveness
His aggressive rating was similar in 2018 and 2019 at 17.7% and 17.8%. On Sunday, this number was 36%, almost double his average. That is the number of tight windows throws, so while this can be a good thing, it can also show that he was not throwing to wide open players often, which is not great.
Expected Completion Percent
In 2018, he had a 1.4 expected completion rate. That means he completed more passes than he should have. In 2019, it went down to -1%, highlighting his regression. Sunday, that number was -0.7. Overall, a lot of these are showing that while his fourth quarter bailed him out, it was still an up and down day, and somewhere in between 2018 and 2019.
CPOE
CPOE, which uses a similar look at completion percentage had him at -2.33 in 2019 and 1.67 in 2019. Unfortunately, on Sunday he had a -6.09 CPOE which correlates more with that high aggressiveness rating. Perhaps some completions he got away with.
EPA/Play
EPA, or expected points added looks into the value of each play that he threw a pass. In 2019, he had a -.02 EPA, showing when he threw passes, it hurt the team. In 2018, he had a 0.2, which is positive. In 2020, he is in between with a 0.08.
EPA/CPOE Composite
Combining the value he brings per play along with the accuracy he brings can really pin point how much fo the success is on his shoulders. In 2019, he had a 0.1, and that number cut in half to 0.058 last year. Unfortunately, those aggressive passes hurt him here, and he had a 0.044 yesterday. He added value by making big plays, but was inaccurate at times and made questionable decisions.
