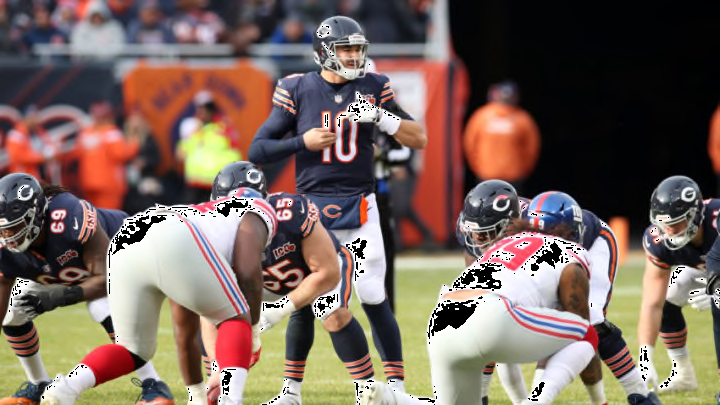
After two weeks, is Mitch Trubisky looking better in 2020 than in the past?
As we will all season, we will go through the advanced stats of Mitch Trubisky and see how they compare to his 2018 season and 2019 season. Many saw 2018 as a peak, or great season, while 2019 was a valley or low season. Which way is 2020 trending when looking specifically at the quarterback position?
Under Pressure
We will get to his performance under pressure after a few weeks. The sample size is too small. However, Trubisky has been pressured on 25% of his dropbacks this season. That is lower than 30% in 2018 and 32% in 2019. One of the most significant differences through the two weeks has been the best pass protection Trubisky has played behind to date. That helps.
Blitz
Teams are not blitzing Trubisky any more of less than they have in the past, too. Trubisky faced between a 26 and 27% blitz rate in his career. In 2020, that number is 26% although, the Lions blitzed nearly twice as much as the Giants.
One of the most significant differences from year one to two is that Trubisky is 12-18 with 2 TDs and 0 INTs vs. the blitz, according to PFF. Last year he had 3 TDs on 75 blitz attempts.
In 2020, his YPA vs. the blitz is 7.5. In 2019 it was 4.9, and in 2018, it was 6.4. This is a great sign early into the season.
Time to Throw
The pass protection shows glaringly in his time to throw. In two years, he averaged 2.65 and 2.64 seconds to pass. This year, he is in the pocket for 2.97 seconds on average before throwing. This could be an issue in that he is holding the ball long. However, combined with his vital stats against the blitz and lower pressure numbers, he is more comfortable behind a better offensive line.
Air Yard Differential
Trubisky throws on average 9.5 yards down the field, which only six players throw deep more often. His average completion distance is 7.2, though. However, his -2.3 air yard differential is right on par for his career. He was at -2.7 in the past two seasons, showing a small growth in this area.
Air Yards To Sticks
This might be the biggest note for Trubisky so far. He averages 1.2 yards beyond the first down marker for every pass he makes. Last year, his passes were -1.2 yards behind the first down marker. In 2018, it was 0.1 yards beyond the sticks. He is standing in the pocket longer, taking shots downfield, and playing to pick up first downs, rather than check down. These are all good signs.
Aggressiveness
The aggressiveness shows a different Trubisky as well. He threw tight windows throws on 17.7% and 17.8% of his passes in 2018 and 2019. In 2020, that number is ballooned up to 34.4%. Only Tyrod Taylor has thrown more tight-window throws. The top 5 in aggressive rates are Taylor, Trubisky, Ryan Fitzpatrick, Daniel Jones, and Dwayne Haskins.
It is good to be aggressive, and throwing deeper and holding the ball longer can lead to this. However, right now, he is a bit overly aggressive. Those are not the names you want to be around.
Expected Completion Rate and CPOE
His expected completion rate is 0.4, and his CPOE is -3.5. In 2018 and 2019, his expected completion rate was 1.4 and -1. His CPOE was 1.67 and -2.33, respectively.
So, he is not completing passes over expectations at the same rate as 2018, but he is not nearly as bad as 2019. Also, his accuracy comes and goes, but did improve from Week one to week two. In all, his accuracy still may be his most important question.
EPA/Play and Composite
His EPA composite score is 0.03, and his EPA/Play is 0.025. For comparison, his composite score was 0.06 and 0.1 in the past two years.
In 2019, Trubisky had a -0.2 EPA/Play, and a 0.2 in 2018. So, as far as adding expected points to each Chicago Bears drive, Trubisky has been better this season than he has in the past.
Overall, his aggressiveness and pass protection has improved his confidence. He is still hit or miss with accuracy, but real data shows that Trubisky is playing better so far in 2020.
