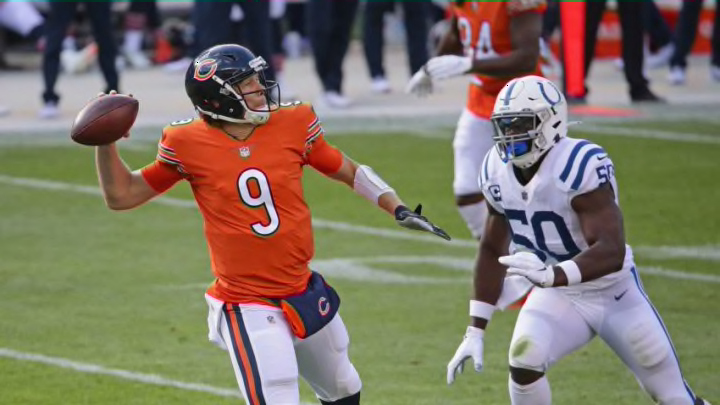
With each playing 2.5 games, how has Nick Foles compared to Mitch Trubisky
Mitch Trubisky has three starts to two for Nick Foles. However, after one possession into the second half of his third start, Mitch Trubisky was pulled. So, with both having played 2.5 games, there is no better time than right now to see what the offenses have looked like over that span.
Raw Stats
Below, you can see how their raw stats compare. Foles has thrown a lot more passes, likely because he spent most his games trailing, while Trubisky led against New York. It also could do with trust in the offense. Still, Foles is completing passes at a higher rate, but has a lower passing rating. Trubisky has more touchdowns with the same number of picks. Trubisky also has three more sacks, though.
"View post on imgur.com"
You can also see one a game-by-game basis that Foles throws more passes. Trubisky also has more boom, but more bust. He has higher yards per attempt and adjusted yards per attempt.
Advanced stats
We saw some advanced and adjusted stats, but PFF, and NextGenStats can provide even more context.
Performance vs. Pressure and blitz
Foles has seen pressure on 34 dropbacks to 24 of Trubisky. That comes with more dropbacks, though. Still, below is a big difference that shows who will start moving forward.
Foles is 18-30 for 231 yards and four sacks. Trubisky is 3-13 for 35 yards and seven sacks. On fewer dropbacks, he has more sacks. Foles also two touchdowns and no picks against pressure. Trubisky has neither a touchdown or a pick.
Trubisky has been blitzed on 27 dropbacks, Foles has been blitzed on 33. Trubisky is 15-24 for 161 yards, Foles was 22-32 for 267 yards. Foles averaged 8.3 yards per attempt against the blitz to 6.7 for Trubisky. Both had three touchdowns, and one sack, but Foles did throw a pick, while Trubiksy did not throw one against the blitz.
Time to throw
The Bears offense is better against pressure and the blitz with Foles, that is because Trubisky has 2.9 seconds from snap to throw on average, while Foles averages 2.5 seconds from snap to throw.
Air Yard Differential, Depth to the sticks
Trubisky averages 10.2 air yards per attempt, while Foles only averages 8.4 air yards. Foles completions are an average of 5.5 yards, while Trubisky is 6.7. Still, that means Foles has a -2.9 air yard differential while Trubisky has a -3.5 AYD.
Beyond that, Trubisky throws the ball two yards passed the first down sticks on average while Foles throws the ball 0.3 yards in front of the markers. Foles plays it safer but is for the better because Trubisky does not complete enough deep balls.
Aggressiveness
As expected, Trubisky has a 31% aggressiveness which is tight-window throws, while Foles is only 24%. Foles 24% rating is high, which shows that Trubisky is over-aggressive and throwing to close to defenders.
Expected Completion Rate, CPOE, EPA
According to NextGenStats, Trubisky completion rate is 1% lower than expected while Foles completed 1.8% of passes more than expected. Foles also have a -0.7 CPOE which adds in air yards, while Trubisky has a -4 CPOE. Again, Trubisky takes his shots downfield more, but they do not pay off enough.
Looking at EPA/Play, Trubisky is slightly better with a 4.5% rate, compared to 3.5% for Foles. However, when you look at the composite of EPA and CPOE, Foles has a 5.3% rating, and Trubisky is at 3.9%. It has been beaten home, but Trubisky does bring more spark. He brings more downside, though.
Foles is a bit boring and safe and is not over the top better by all accounts. However, he has run the offense more smooth and has handled the pressure better. Foles will continue to start and for good reason.
