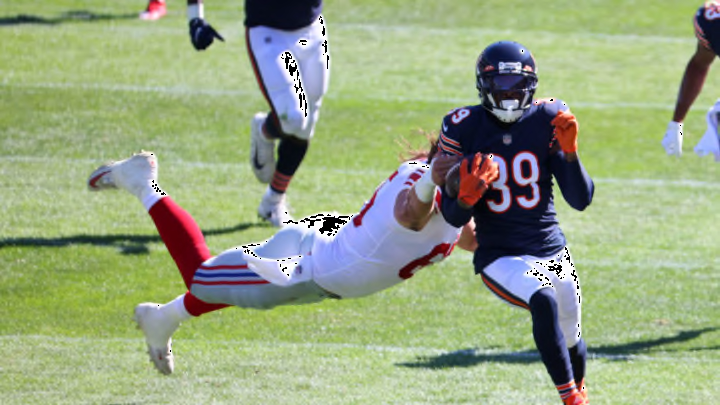
Chicago Bears: Where the offense ranks in meaningful statistics
Points per play — 0.32 (No. 27)
Red zone appearances per game — 3.0 (25th)
Offensive points per game — 21.0 (27th)
Defensive points per game — 0.0 (T-16th)
Special teams points per game — 0.0 (T-3rd)
In the words of the great Michael Scott, “Oh, how the turntables.” It’d have been bewilderment to even suggest that the Bears would be six weeks into a season without a single score from the defensive unit. By nature, that’s just how Chicago has always operated.
The defense has mitigated that a bit, through to their ability to force turnovers on downs in successive weeks to begin the year. But this is a 4-1 team that has gotten into the endzone exclusively through that question mark of an offense. Who would’ve thought?
Even so, make no mistake. The Bears’ offense is still only treading by. It’s perhaps most evident through this stat: only three teams in the NFL pass the ball more than the Bears do (39.8 attempts per game), and yet the Bears rank just 23rd in passing yards, per Team Rankings.
That dink-and-dunk success is one that the Bears’ would’ve taken last season; it allows the defense to rest, and the offense to win the time of possession battle. But, like a cheap motel, there is certainly room for improvement. They own the No. 26 ranking in offensive DVOA, at -14.7.
Here’s how the Bears rank on a per drive status, per Football Outsiders, which showcases that methodical offense.
Yards per drive — 30.8 (26th)
Points per drive — 1.88 (25th)
Plays per drive — 5.95 (26th)
Looking at it situationally, the Bears are an interesting case study. All off-season long, we’ve heard about how the Bears were planning to employ a more consistent attack. David Montgomery’s carries are on the downturn — 10 in each of the last two weeks — but he’s averaging 4.7 yards per touch, compared to 3.8 yards last season.
Here’s how the rush vs. pass disparity and offensive line play looks:
Rushing attempts per game — 23.0 (29th)
Rushing yards per game — 95.4 (27th)
Rushing play percentage — 35.4% (29th)
Rushing yards percentage — 29.5 percent (21st)
Passing attempts per game — 39.8 (4th)
Passing yards per game — 227.8 (23rd)
Passing yards per attempt — 5.7 (27th)
Passing sack percentage — 5.2 percent (18th)
Passer rating per game — 85.4 (26th)
Run blocking adjusted yards — 4.50 (12th)
Adjusted sack rate — 5.6 (13th)
Interceptions thrown per game — 1.2 (27th-best)
Fumbles per game — 1.0 (15th)
As the lead back, Montgomery’s statistics tell the clearest story. He’s a perfect 100 percent on third downs, but the Bears have only trusted him on third-to-go situations three times. And, he hadn’t had a ton of looks down in the red zone, before finally pushing in his first touchdown against Tampa Bay.
TheBreakfastClubDub.gif https://t.co/kUfd2nICn8
— Chicago Bears (@ChicagoBears) October 9, 2020
My hunch is that those attempts continue to go down, especially with the loss of James Daniels. But in a nutshell, this is how the Bears have performed this year: below average until it really matters.
