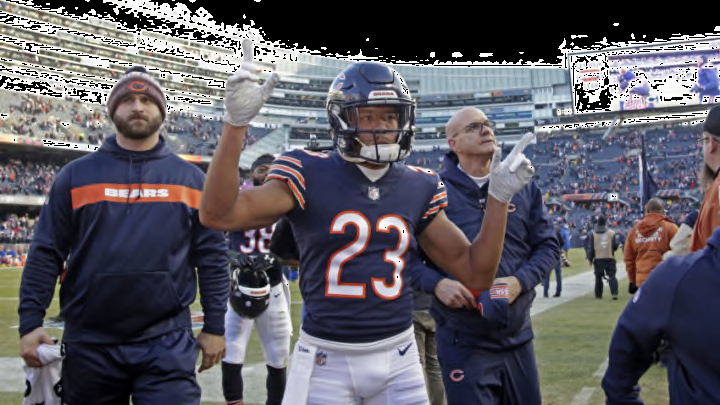
What do the advanced stats have to say about Kyle Fuller and his 2019 for the Chicago Bears?
Digging into the advanced stats of Chicago Bears players 2019 seasons has given us great context already. We have been able to see the true value that David Montgomery brought, and what it may take to get more out of Tarik Cohen.
We have also done advanced stats reviews on Charles Leno, and each new addition to the team this offseason.
With that in mind, it is time to look into the defensive side of the football with Kyle Fuller. Fuller was elite in 2018, but many would say his 2019 season did not meet the play. What do the stats say?
Raw Stats
In 2018, Kyle Fuller gave up 69 receptions for 819 yards. In 2019, it was 67 for 887 yards. A small drop in yards allowed, but on the surface, nothing major. However, it is fair to note that in 2018, he was 25% of the opposing team’s targets, while only 22% last year. Teams started to avoid him more, although he still gave up about the same.
You can also see it from 17 pass breakups and seven interceptions in 2018 compared to just nine pass breakups and three interceptions in 2019. Lastly, Fuller had eight penalties last year compared to just three in 2018. You can start to see the real differences.
Advanced Stats
The advanced stats can tell us an even more clear picture. First, his average depth of target was about the same, going from 10.1 to 10.8. His snaps per target were 6.3 in both seasons as well, although he saw less of the overall target share.
However. his yards per snap allowed increased from 1.13 to 1.43 according to PFF. His snaps per reception allowed dropped from 10.5 to 9.3. His yards per target got worse, from 7.2 to 9 and his yards per reception allowed went from 11.8 to 13.3. He was targeted less, but less efficient, allowing more receptions on those snaps and targets as well as more yards.
All said that resulted in a passer rating allowed to shoot from a 69.2 to 93.3.
Film Based Stats
Using player profiler, they were able to chart how much separation each receiver got, and when a cornerback was burnt which meant allowing five or more yards of separation. This aligned with the production allowed, as he went from a 0.7% burn rate to 1.9%. He went from 1.1 yards of separation allowed to 1.5.
Tackling
His yards after the catch per reception went from 3.83 to 4.12. This is no surprise as his yards allowed increased, but he was allowing more of those yards after the catch.
However, it is fair to say that he was more physical and took on more work as a run defender. His run stop rate grew from 0.7 to 1.8. Beyond that, his missed tackles stayed at three, but with more run stuff, his tackle efficiency went from 11 to 20. He was more efficient against the run, for sure.
Overall
Overall, the run is arguably the only thing where numbers can show Kyle Fuller being better in 2019 than he was in 2019. It is fair to note that he was elite in 2019, and his numbers were still good by most metrics.
However, there was not an area where he could continue his same dominant play. Fuller still has the reputation and with a rookie likely starting across from him, will still see fewer targets. Still, this means even more that Fuller has to stay at his peak level because one slip up can show in a big way when he is not being targeted as much.
